
Amid a challenging environment, marked by softened metal prices, Hindustan Zinc continued to maintain its margin, underlining its inherent resilience. Sustained cost reduction was a key contributor to the Company’s success in keeping its margin at a steady 47%. Hindustan Zinc clocked the lowest cost in the last three years during FY 2023-24, underscoring its decision-making agility. Maximisation of silver production to leverage the rising silver prices, coupled with modifications in the power plant to ensure better linkage to coal consumption, helped in the reduction of the power costs, while promoting operational and commercial efficiencies.
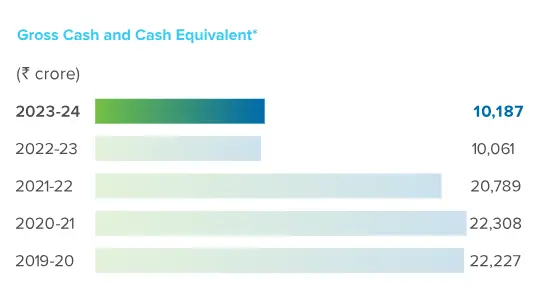
* Includes cash and cash equivalents, investments as applicable and other bank balances excluding dividend account balance
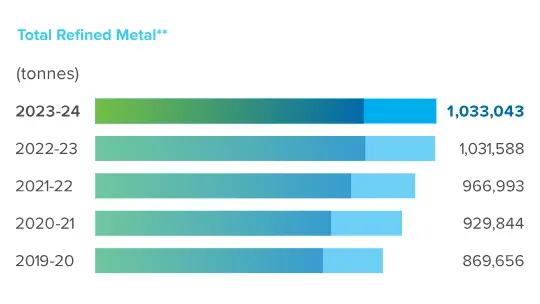
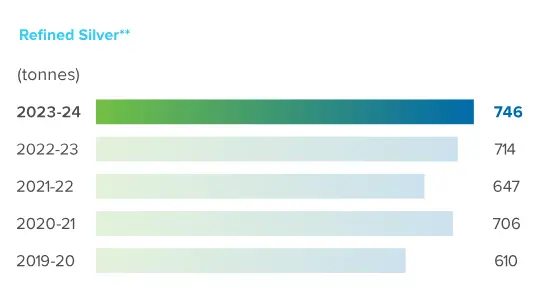
** Excludes captive consumption
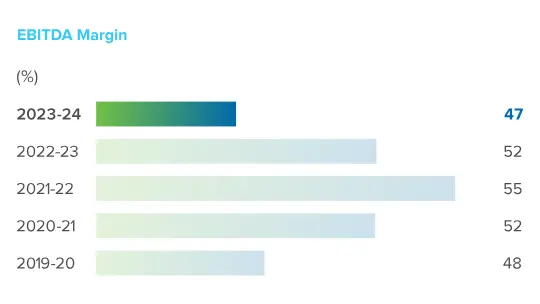
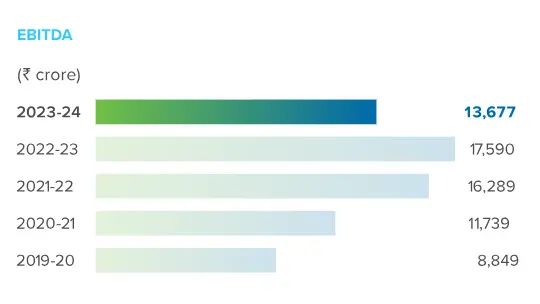
Earnings before interest, tax, depreciation and amortisation (EBITDA) is a factor of volume, prices and cost of production. This measure is calculated by adjusting operating profit for special items and adding depreciation and amortisation and dividing it by revenue from operations.
EBITDA margin decreased from 52% in FY 2022-23 to 47% in FY 2023-24 primarily due to lower revenue from operations on account of lower zinc LME prices partially offset by lower coal & input commodity prices and mining royalty.
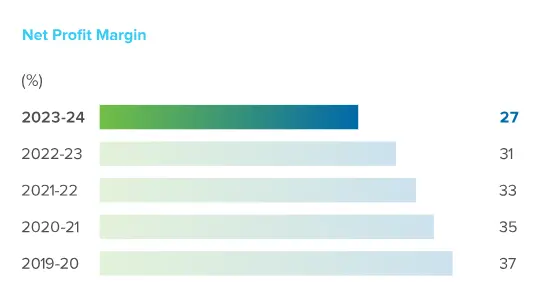
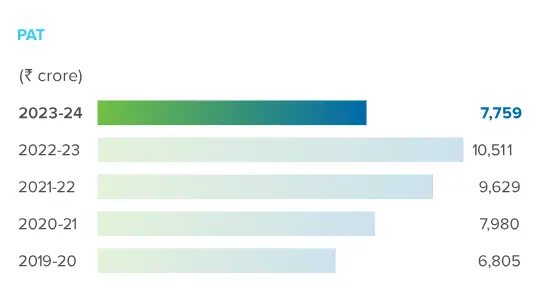
This is a measure of the profitability of a company. It is calculated as a ratio of net profit (before exceptional items) to revenue from operations (including other operating income).
Net profit margin is lower on account of lower revenue from operations due to lower zinc LME prices, higher finance cost partially offset by lower tax expense (owing to lower profits in current year & adoption of lower tax rate) and lower cost of production.
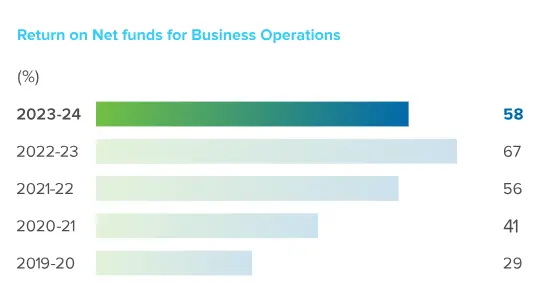
This is calculated on the basis of operating profit net of tax expenses, as a ratio of net funds for business operations. The objective is to earn a post-tax return consistently above the weighted average cost of capital.
The decrease in return on net funds for business operations is mainly on account of lower operating profit net of taxes partially offset by lower net funds employed for business operations.
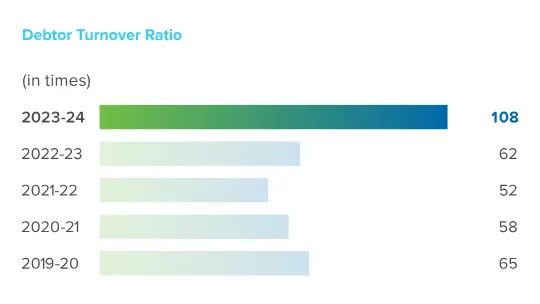
The debtors’ turnover ratio is an accounting measure used to quantify a company’s effectiveness in collecting its receivables. This is calculated as a ratio of revenue from operation (including other operating income) to average trade receivables.
Increase in debtor turnover ratio is primarily on account of lower trade receivables as compared to previous financial year, slightly offset by lower revenue from operations.
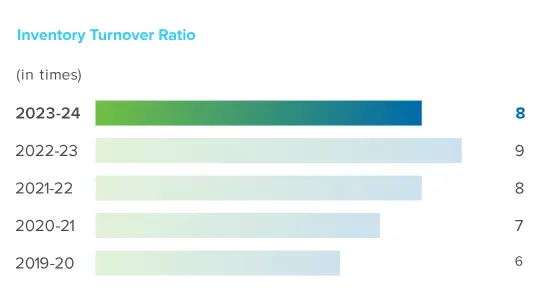
The inventory turnover ratio is an efficiency ratio that shows how effectively inventory is managed. This is calculated as a ratio of the cost of goods sold to average inventory.
Inventory turnover ratio was marginally lower on account of lower cost of goods sold.
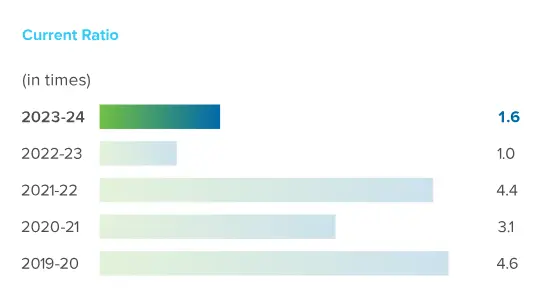
The current ratio is a liquidity ratio that measures a company’s ability to pay short-term obligations or those due within one year. This is calculated as a ratio of current assets to current liabilities.
The current ratio is higher mainly on repayment of short-term borrowings during the year.
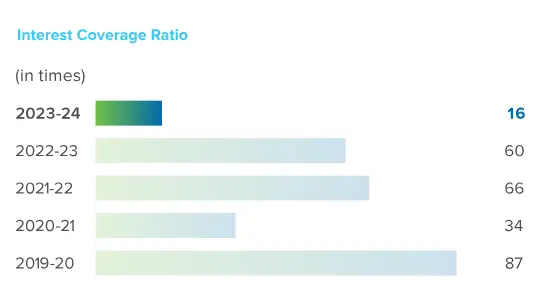
The ratio is a representation of the ability of the Company to service its debt. It is computed as a ratio of EBITDA divided by finance costs.
The interest coverage ratio is lower on account of higher finance cost and lower EBITDA.
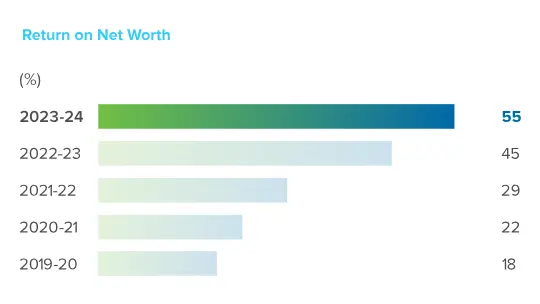
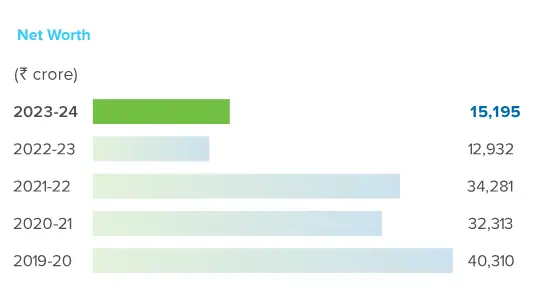
Return on net worth is a measure of the profitability of the Company. This is calculated as a ratio of net profit (before exceptional items) to average net worth (share capital + reserves).
Return on net worth is higher mainly because lower retained earnings are partially offset by lower net profits after tax.
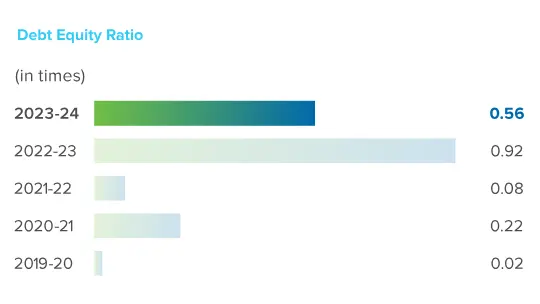
The debt-to-equity ratio reflects the Company’s ability to meet its short-term and long-term obligations in proportion to the net worth of the Company.
Debt equity ratio is lower on account of lower borrowings and higher retained earnings.
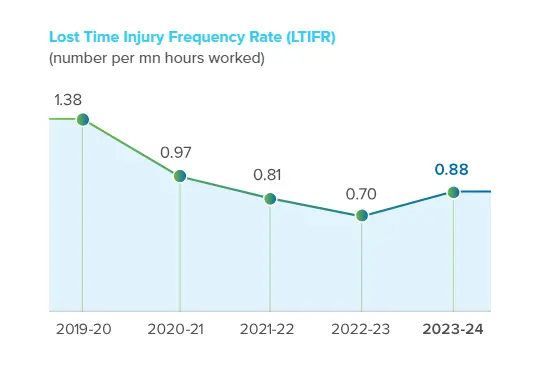
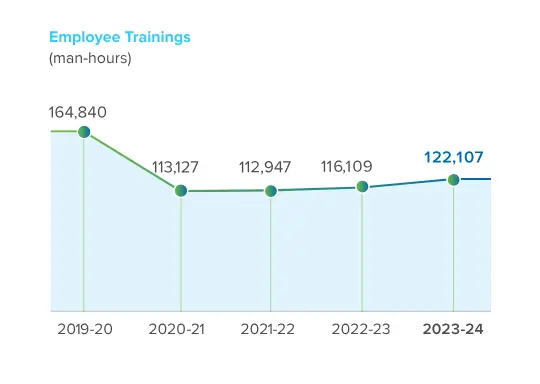
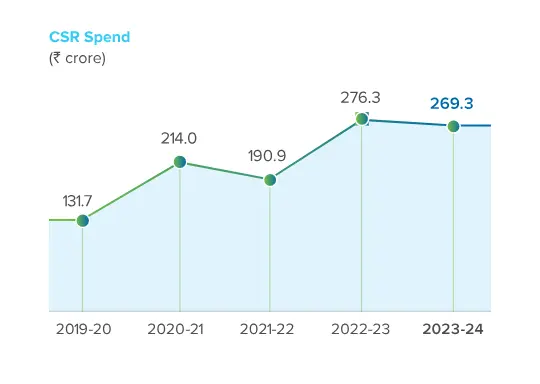
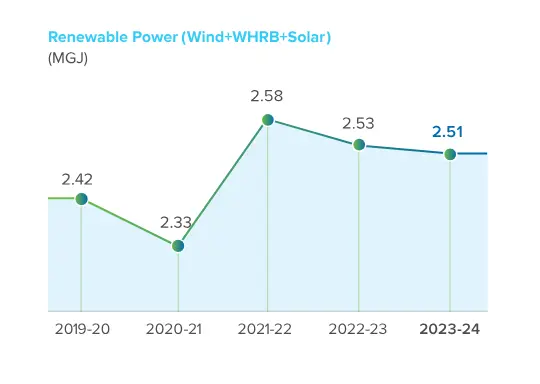
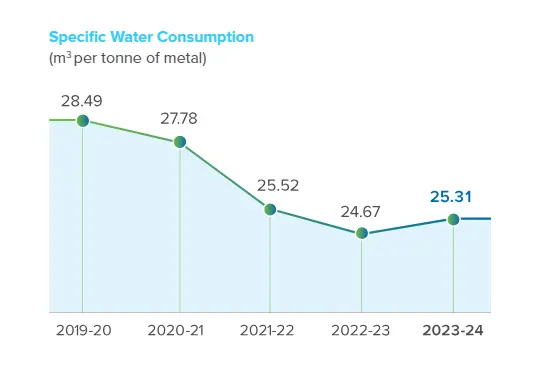
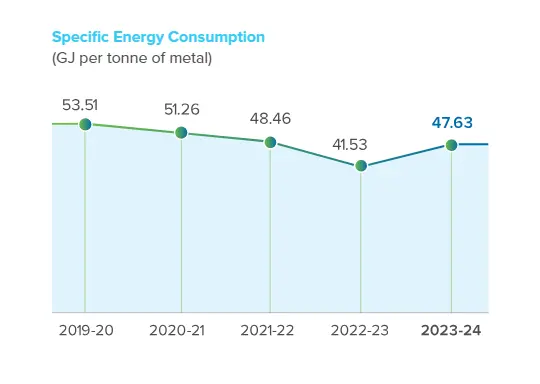
Our Environmental, Social and Governance (ESG) focus has enabled us to deliver sustained performance and growth across key ESG metrics. We are continuously working towards reducing our carbon footprint and lowering the impact of our business on environment through our concerted efforts. These efforts aim to improve operational efficiencies, ensure optimal utilisation of natural resources and increase the use of renewable energy in our plants and processes. Safety and health of our workforce at our workplace is central to our ESG strategy.
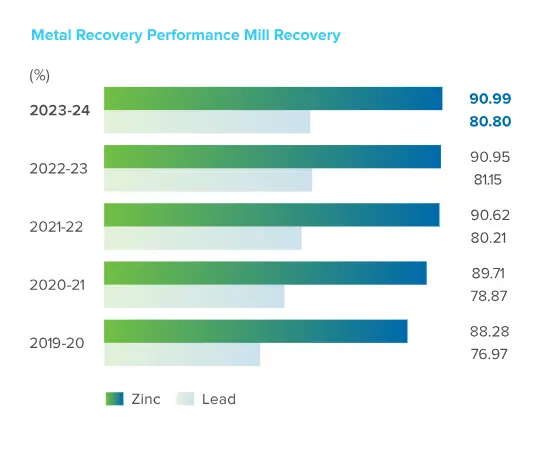
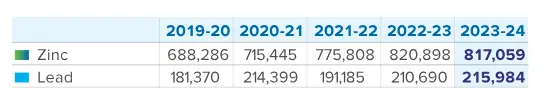
Note: Overall mill recovery for lead is lower in FY 2023-24 on account of the new RD Mill stabilisation
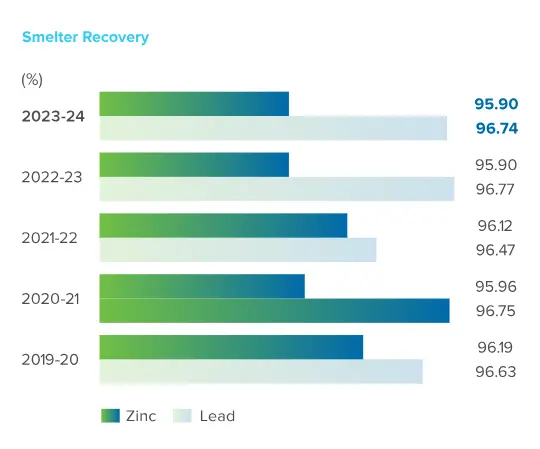
Note: Overall smelter recovery for lead is lower in FY 2023-24 in line with the recovery in Dariba Lead Smelter
*on gross basis
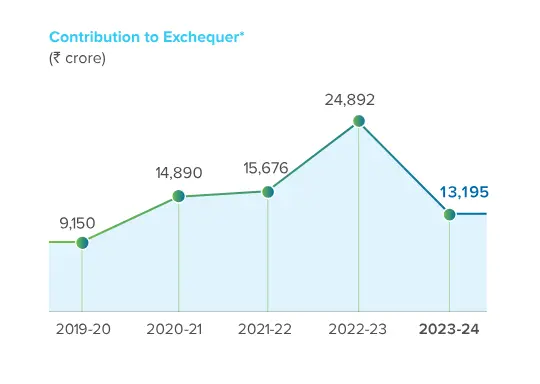
Note: Contribution to exchequer during the year is lower in line with the revenue and dividend payout to the government.
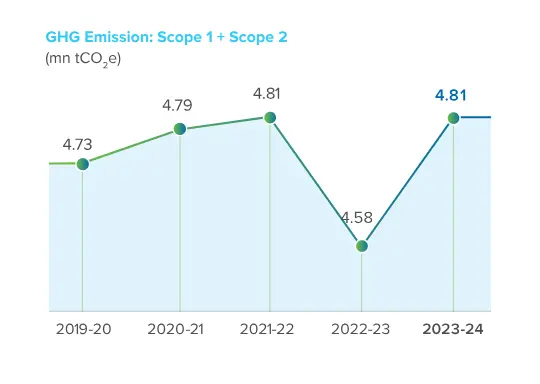
Note: GHG emissions are higher than FY 2022-23 on account of higher reliance on CPPs during FY 2023-24
Economic value added (EVA) is a measure of a company’s financial performance based on income generated post charging for the cost of capital provided by lenders and shareholders. It represents the value added for the shareholders by generating operating profits over the cost of capital employed in the business.
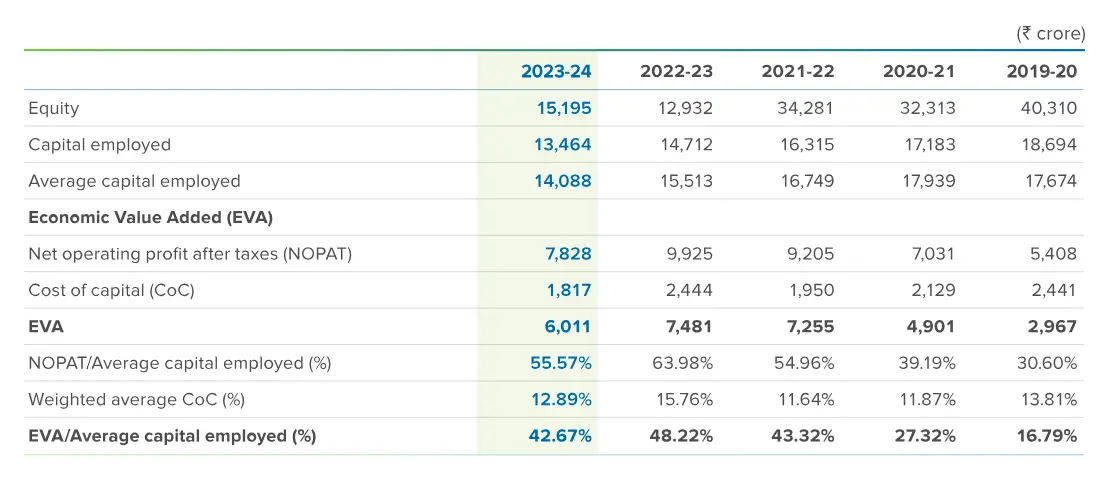
NOPAT: Net operating profit after tax (NOPAT) is a financial measure that shows how well a company performed through its core operations, net of taxes. It is calculated as profit after depreciation and tax, but before interest.
Cost of Capital: Cost of capital is the return expected by investors to compensate them for the variability in return caused by fluctuating earnings and share prices.
Capital Employed: Capital employed is the total amount of funds deployed in the business to generate profit exclusive of net cash and cash equivalents.